Scale Reporting · NetSuite

Stop rebuilding the same report

Which spreadsheet does your team rebuild every week or every month? If it starts with a NetSuite export and ends with someone checking formulas or reconciling figures, AVT can build it in NetSuite, with NetSuite as your system of record, so every team works from one version of the numbers.

One version of the truth, traced back to NetSuite transactions
Self-service reporting for finance, sales and operations
Start with one report: a free assessment of what's possible
Less time preparing reportsThe report runs in NetSuite instead of being rebuilt each week or month.
Fewer delaysYour team opens the report from their own NetSuite login, when they need it.
Less reliance on one personNo single spreadsheet owner holding up the numbers as your business grows.

See it in two minutes

See what NetSuite reporting looks like for each team, from sales and gross profit to where cash is tied up in slow-moving stock.
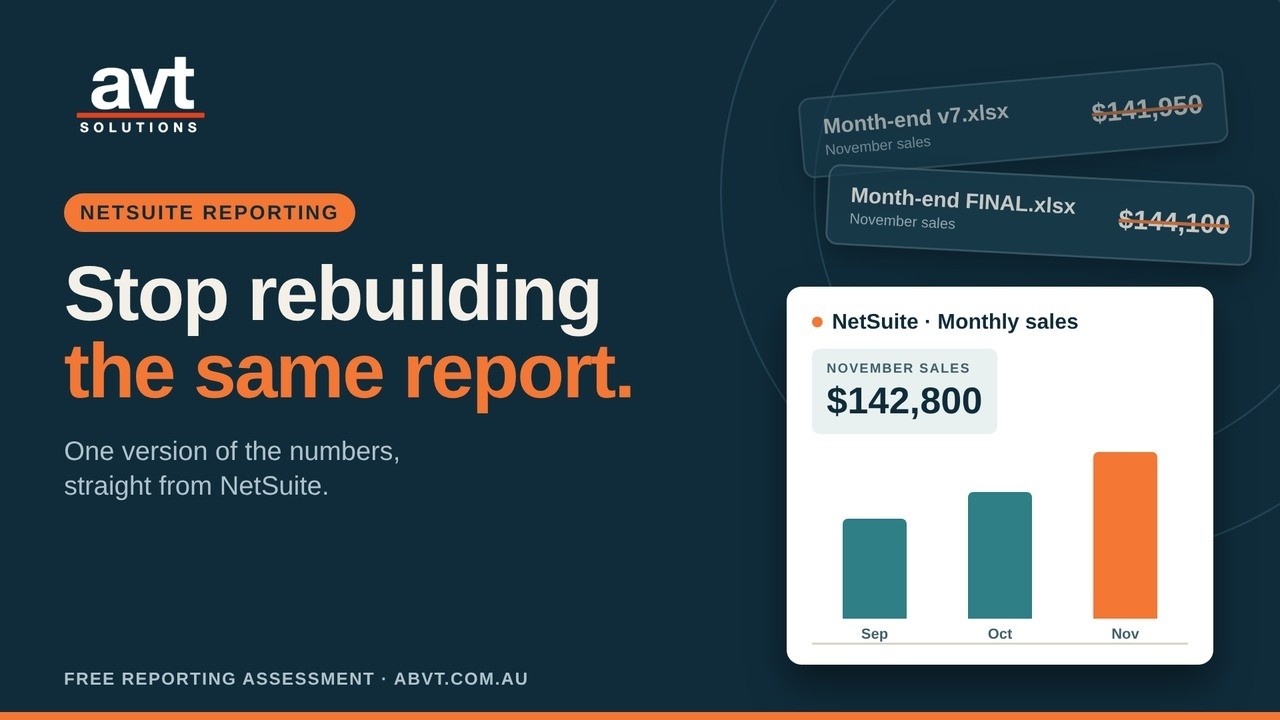
Stop rebuilding the same report: better NetSuite reporting with AVT
Read the video transcript

Which spreadsheet does your team rebuild every week or every month?

If it starts with a NetSuite export and ends with someone checking formulas or reconciling figures, send us the template.

We can review where the numbers come from and recommend how to build the report in NetSuite or a connected dashboard, with NetSuite as your system of record. When the report runs in NetSuite, your team can open it from their own login. That means less time preparing reports, fewer delays, and less reliance on one person as your business grows.

Here’s what that can look like in practice.

For sales, a NetSuite workbook compares revenue and gross profit with last year. Your team can break it down by state, product group or customer, and finance can check the totals against the profit and loss report.

For purchasing, a stock consumption report shows how much you use each week and how many weeks of stock are left at each location. That helps buyers decide what to reorder and what to hold.

For distributors, an order fulfilment report shows which orders are due to ship today, which are already late, and which are waiting for stock. Pair it with an inbound purchase order report so the team can see when replenishment is expected and update customers.

For manufacturers, a work order status report shows what’s due to start, what’s in progress, and what’s running late. A material shortages report flags which components are missing and which jobs they affect, so planners can chase supplies or resequence the schedule.

For after-sales service, a warranty claims report can show which claims are open, how long they’ve been waiting, and what they cost by product. That helps the team prioritise overdue claims and spot recurring faults. A repair backlog report can show which jobs are awaiting diagnosis, parts, or testing, so support can flag delays and give customers a realistic completion date.

And for the board, a saved search can flag slow-moving stock and items with no sales in the past year. Those results can feed a one-page summary showing where cash is tied up and which actions need a decision.

Start with one spreadsheet. A blank template or a sample with dummy data is enough. Talk to us for a free assessment. We’ll explain what’s possible for your report, what it would take to build, and what it’s likely to cost.

Why spreadsheet reporting breaks down

Every month the same loop: export, copy, reconcile, repeat. It eats days at month-end, and nobody is sure which number is right.

1
Export

Saved searches downloaded to CSV, by every team, every month.

2
Copy

Pasted into the master workbook, formulas fixed, tabs re-linked.

3
Reconcile

Three versions of the same month-end number. Which one is right?

4
Repeat

Next month it starts again, and it stops when the spreadsheet owner is away.

One version of the truth, built on NetSuite

Reports read straight from NetSuite transactions, so the numbers in every report agree with the ledger.

▦
Reports built in NetSuite

Saved searches, SuiteAnalytics workbooks, dashboards and KPI scorecards, using the reporting tools already in your NetSuite account.

◆
Or a connected dashboard

When you need a BI tool, we connect it to NetSuite as the system of record, so every figure still traces back to a NetSuite transaction.

▶
Self-service for every team

Your team opens the report from their own NetSuite login, with roles, filters and saved views, without exporting or waiting on someone else.

What that looks like in practice

Real reports we build in NetSuite, team by team. Previews use illustrative data.

Sales & finance

Revenue and gross profit vs last year

A NetSuite workbook compares revenue and gross profit with last year. Your team breaks it down by state, product group or customer, and finance checks the totals against the profit and loss report.

Helps youSee which states, products and customers are growing, and trust the totals.
Revenue & GP vs last yearBy state
StateRevenuevs LYGP %
NSW$412.3k+8.1%31.2
VIC$389.9k+3.4%29.8
QLD$201.5k−2.2%28.9
Total$1,003.7k+4.0%30.3
✓ Totals agree with the P&L
Purchasing

Stock consumption report

Shows how much you use each week and how many weeks of stock are left at each location, so buyers can decide what to reorder and what to hold.

Helps youReorder on time without overstocking.
Stock consumptionWeekly, by location
ItemLocationUse / wkWeeks left
Bearing 6204Sydney1201.5Reorder
Seal kit SK-40Melbourne456.2OK
Motor M-110Brisbane822.0Hold
Distribution

Order fulfilment report

Shows which orders are due to ship today, which are already late, and which are waiting for stock.

Inbound purchase order report

Paired with fulfilment, it shows when replenishment is expected, so the team can update customers.

Helps youShip on time and give customers accurate dates.
Order fulfilmentToday
OrderCustomerShip by
SO-4821Harbour SuppliesTodayDue today
SO-4799Coastline Retail2 days agoLate
SO-4830Metro TradeTomorrowWaiting for stock
Inbound purchase orders
PO-1187Bearing 6204 × 600ETA 12 Dec
PO-1192Valve V-25 × 200ETA 16 Dec
Manufacturing

Work order status report

Shows what's due to start, what's in progress, and what's running late.

Material shortages report

Flags which components are missing and which jobs they affect, so planners can chase supplies or resequence the schedule.

Helps youKeep jobs on schedule and chase the right parts first.
Work order statusThis week
Work orderItemStart
WO-2201Pump assembly P-20MonDue to start
WO-2188Control unit CU-4Last ThuIn progress
WO-2175Frame kit FK-9Last MonLate
Material shortages
PCB-12Short 40WO-2201, WO-2210
Gasket G-8Short 120WO-2175
After-sales service

Warranty claims report

Shows which claims are open, how long they've been waiting, and what they cost by product, so the team can prioritise overdue claims and spot recurring faults.

Repair backlog report

Shows which jobs are awaiting diagnosis, parts or testing, so support can flag delays and give customers a realistic completion date.

Helps youClear overdue claims and set honest repair dates.
Open warranty claimsBy product
ClaimProductDays openCost
WC-318Pump P-2034$420
WC-322Pump P-2019$385
WC-327Valve V-254$110
Repair backlog
6Awaiting diagnosis
4Awaiting parts
3In testing
Board reporting

Slow-moving stock saved search

A saved search flags slow-moving stock and items with no sales in the past year. The results feed a one-page summary showing where cash is tied up and which actions need a decision.

Helps youFree up working capital with clear decisions for the board.
Where cash is tied upOne-page summary
Slow-moving stock$182,400
No sales in 12 months$64,900
Decisions needed

Clear 12 obsolete SKUs · Return 3 lines to supplier · Cut reorder points on 8 items

Start with one report

Send us one spreadsheet you rebuild every week or month. We'll explain what's possible, what it would take to build and what it's likely to cost, free.

1
Send the template

The spreadsheet your team rebuilds every week or month. A blank template or a sample with dummy data is enough.

2
Free assessment

We review where the numbers come from and recommend how to build it, with what it would take and what it's likely to cost.

3
We build it in NetSuite

In NetSuite, or as a connected dashboard, checked against your existing numbers.

4
Your team runs it

From their own NetSuite login, whenever they need it. Then pick the next report.

Send us the spreadsheet you keep rebuilding

Tell us about the report and attach the template if you can. We'll review where the numbers come from and explain what's possible, what it would take to build and what it's likely to cost.

  • Free, with no obligation
  • Reviewed by a senior NetSuite reporting consultant
  • A blank template or a sample with dummy data is enough
  • Not on NetSuite yet? We'll show what it would look like

We use your details only to respond to this request. See our privacy policy.

✓

Thanks, we've got it

A senior NetSuite reporting consultant will review your report and be in touch within one business day.

NetSuite reporting questions, answered

Do we need to be on NetSuite?
The reports are built on NetSuite as the system of record. If you're evaluating NetSuite, send us a spreadsheet anyway and we'll show what the report would look like once you're live.
Do we need a separate BI tool?
Often not. Many reports can be built with saved searches, SuiteAnalytics workbooks and dashboards already in NetSuite. Where a BI tool adds value, we connect it with NetSuite as the source, so the numbers still agree.
Is it safe to send you our spreadsheet?
It's used only to scope your report. A blank template or a sample with dummy data is enough: we mainly need the layout, the columns and how the numbers are worked out.
What does the assessment cost?
Nothing. We explain what's possible for your report, what it would take to build and what it's likely to cost, with no obligation.
Can our team run the reports themselves?
Yes. When the report runs in NetSuite, your team opens it from their own login. We set up roles, filters and saved views so finance, sales and operations can run and adjust their own reports.
How long does a report take to build?
It depends on the report and your data. The free assessment gives you the build effort and an estimated cost before you commit.

Start with one report

A blank template or a sample with dummy data is enough. We'll explain what's possible for your report, what it would take to build and what it's likely to cost, free.