Most security teams already watch identity, endpoints, cloud and email from one place: Splunk or Microsoft Sentinel. The ERP usually isn’t on that screen. NetSuite holds the general ledger, the vendor master, payment runs and every role that can touch them, yet a new Administrator, a self-approved exception or a risky saved search stays invisible to the SOC until someone opens NetSuite and goes looking.
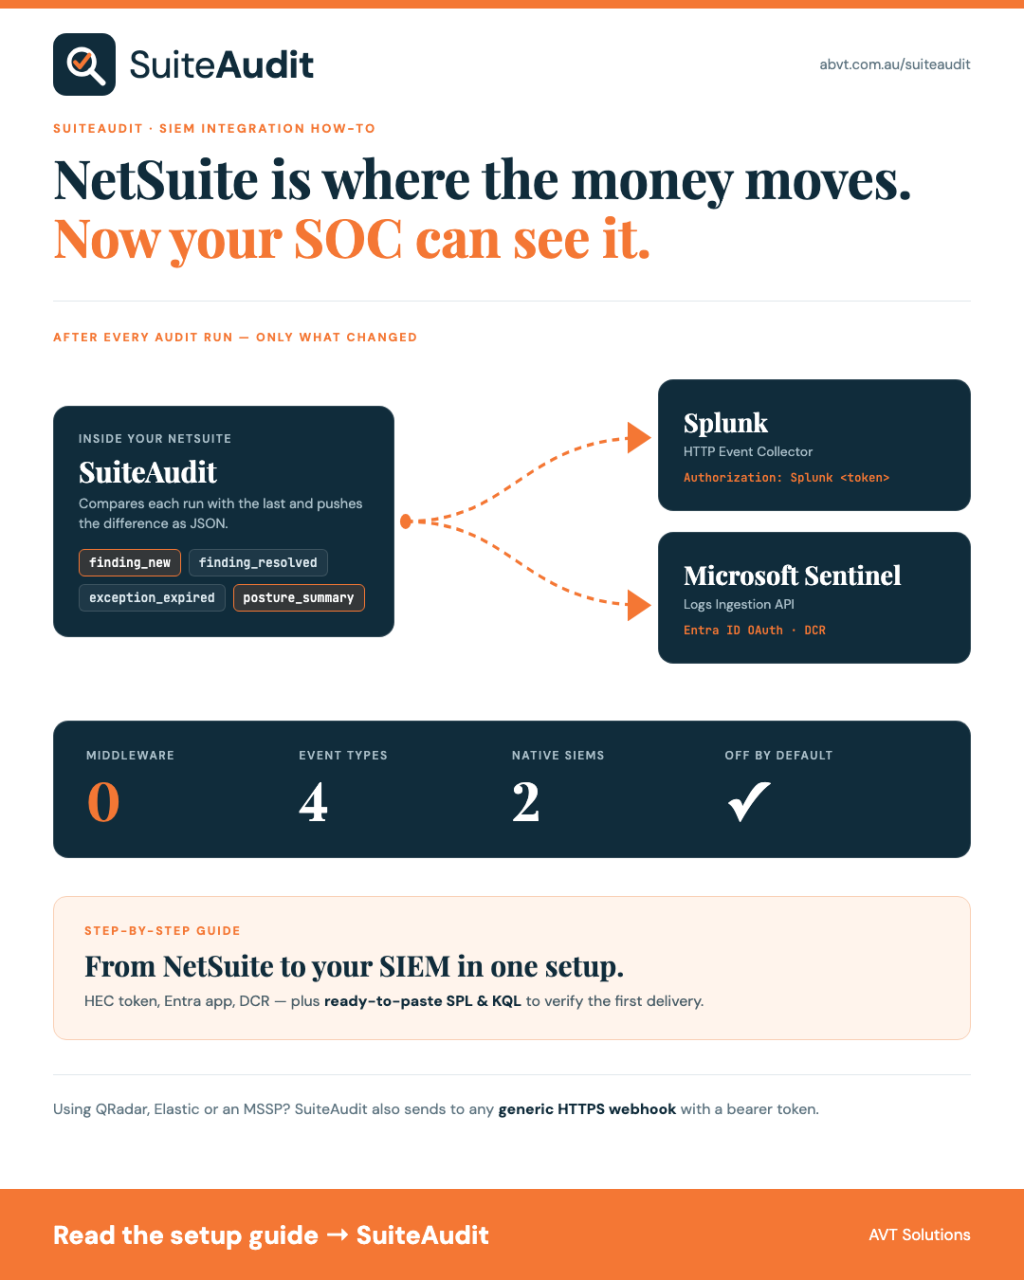
SuiteAudit closes that gap. After every audit run it works out what changed in your NetSuite account’s governance posture and pushes those changes straight to your SIEM as structured JSON. No middleware, no export-and-upload, no polling script on a server somewhere.
This guide walks through connecting SuiteAudit to Splunk (via the HTTP Event Collector) and to Microsoft Sentinel (via the Azure Monitor Logs Ingestion API), then verifying the data with a few ready-to-paste searches.
What SuiteAudit sends
SuiteAudit doesn’t stream every finding on every run. It compares each audit run with the previous completed one and sends only what changed, plus one summary of the account’s overall posture:
finding_new: a finding that wasn’t there last run (for example, a user who just picked up an Administrator role or a newly exposed File Cabinet folder).finding_resolved: a finding from last run that has since been fixed.exception_expired: a finding that was accepted as an exception last run, where that acceptance has now lapsed.posture_summary: one per run, carrying the account’s risk score, the change since last run and counts by severity.
A typical delivery looks like this:
{
  "source": "suiteaudit",
  "account": "1234567",
  "generated": "2026-11-16T08:05:55.124Z",
  "events": [
    {
      "event_type": "finding_new",
      "account": "1234567",
      "key": "FILE-01|folder|13568",
      "check_id": "FILE-01",
      "severity": "serious",
      "subject_kind": "folder",
      "subject": "SuiteScripts : DriverDeliveries : Photos",
      "subject_id": "13568",
      "disposition": "open",
      "self_approved": false,
      "confidence": "high",
      "timestamp": "2026-11-16T08:05:52.717Z"
    },
    {
      "event_type": "posture_summary",
      "account": "1234567",
      "risk_score": 100,
      "risk_score_previous": 100,
      "risk_score_delta": 0,
      "counts": { "critical": 13, "serious": 14, "warning": 3, "info": 0 },
      "findings_total": 565,
      "confidence": "high",
      "timestamp": "2026-11-16T08:05:52.717Z"
    }
  ]
}
Every finding carries a stable key (check + subject type + internal ID), so you can follow a single issue from finding_new through to finding_resolved across runs.
Expect a big first delivery. On the very first run there’s no previous run to compare with, so every open finding arrives as
finding_new. That can be several hundred events. Runs after that only carry the changes.
Before you start
- SuiteAudit installed in your NetSuite account, with at least one completed audit run.
- A NetSuite Administrator (or a role with access to SuiteAudit’s custom records) to create the SIEM destination.
- Admin access to your Splunk instance or Azure subscription.
- A receiving endpoint that NetSuite can reach over the public internet, using HTTPS and a certificate from a public certificate authority.
SIEM destinations are configured in NetSuite at Customization → Lists, Records & Fields → Record Types → AVT SIEM Destination → New. Each destination is off by default: nothing leaves NetSuite until you tick Enabled. You can configure more than one destination (Splunk and Sentinel side by side, for example), and each is sent to independently, so a failure at one never blocks the other.
Option 1: Splunk (HTTP Event Collector)
SuiteAudit talks to Splunk’s HTTP Event Collector (HEC) natively. It wraps each event in HEC’s {"event": …} envelope and sends the Authorization: Splunk <token> header itself, so there’s nothing to transform on the Splunk side.
Step 1: Create an HEC token in Splunk
- In Splunk Web, go to Settings → Data Inputs → HTTP Event Collector.
- Click Global Settings and make sure All Tokens is Enabled and Enable SSL is ticked.
- Click New Token and give it a name such as
suiteaudit. Leave Enable indexer acknowledgement unticked. - On the input settings screen, set Source type to
_jsonand choose the target index (a dedicated index such asnetsuite_auditkeeps retention and access control simple). - Review, submit and copy the token value.
Step 2: Work out your HEC endpoint URL
- Splunk Cloud Platform:
https://http-inputs-<your-stack>.splunkcloud.com/services/collector/event - Splunk Enterprise:
https://<splunk-server>:8088/services/collector/event
Use the /services/collector/event endpoint, not /raw. SuiteAudit already sends the event envelope that this endpoint expects.
For Splunk Enterprise, the HEC port must be reachable from NetSuite’s data centres and must present a certificate signed by a public CA. Splunk’s default self-signed certificate won’t be trusted.
Step 3: Create the SuiteAudit destination
In NetSuite, create a new AVT SIEM Destination:
| Field | Value |
|---|---|
| Name | Splunk (production) |
| Destination Type | Splunk HTTP Event Collector |
| Endpoint URL | Your HEC URL from Step 2 |
| Bearer Token (Splunk / Generic Webhook) | The HEC token only. SuiteAudit adds the Splunk prefix itself. |
| Enabled | Ticked |
Save. The next audit run will deliver to Splunk.
Step 4: Verify in Splunk
Confirm events are arriving, broken down by type:
index=netsuite_audit sourcetype=_json source=* event_type=*
| stats count by account, event_type
Track each account’s risk score over time:
index=netsuite_audit event_type=posture_summary
| timechart span=1d latest(risk_score) by account
Pull out new critical and serious findings, a good starting point for an alert:
index=netsuite_audit event_type=finding_new severity IN ("critical","serious")
| table _time, account, check_id, severity, subject_kind, subject, self_approved
Option 2: Microsoft Sentinel (Logs Ingestion API)
Sentinel stores its data in a Log Analytics workspace, and custom data enters through the Azure Monitor Logs Ingestion API. That API doesn’t accept a static key. It requires a Microsoft Entra ID (Azure AD) OAuth token. SuiteAudit handles that exchange itself: you give it an app registration, and before each delivery it requests a short-lived token and sends each event to your Data Collection Rule. You don’t need a Logic App or Azure Function in between.
Step 1: Register an app in Microsoft Entra ID
- In the Azure portal, go to Microsoft Entra ID → App registrations → New registration. Name it something like
SuiteAudit-NetSuite-Ingest, single tenant, no redirect URI. - From the Overview page, copy the Directory (tenant) ID and Application (client) ID.
- Go to Certificates & secrets → New client secret, set an expiry that fits your rotation policy, and copy the secret value (not the secret ID). It’s shown only once.
Step 2: Create a Data Collection Endpoint
Go to Monitor → Data Collection Endpoints → Create. Create it in the same region as your Log Analytics workspace. Once deployed, open it and copy the Logs Ingestion URI (it looks like https://<name>.<region>-1.ingest.monitor.azure.com).
Step 3: Create the custom table and Data Collection Rule
- Open the Log Analytics workspace behind your Sentinel instance and go to Tables → Create → New custom log (DCR-based).
- Name the table
SuiteAudit(Azure adds the_CLsuffix, givingSuiteAudit_CL). - Click Create a new data collection rule, name it (for example
dcr-suiteaudit) and select the Data Collection Endpoint from Step 2. - When asked for a sample, upload a JSON file containing one finding event and one posture event, so Azure creates columns for both shapes:
[
  {
    "event_type": "finding_new", "account": "1234567",
    "key": "FILE-01|folder|13568", "check_id": "FILE-01", "severity": "serious",
    "subject_kind": "folder", "subject": "SuiteScripts : Example", "subject_id": "13568",
    "disposition": "open", "self_approved": false, "confidence": "high",
    "timestamp": "2026-11-16T08:05:52.717Z"
  },
  {
    "event_type": "posture_summary", "account": "1234567",
    "risk_score": 100, "risk_score_previous": 100, "risk_score_delta": 0,
    "counts": { "critical": 13, "serious": 14, "warning": 3, "info": 0 },
    "findings_total": 565, "confidence": "high",
    "timestamp": "2026-11-16T08:05:52.717Z"
  }
]- The wizard will warn that there’s no
TimeGeneratedcolumn. Open the Transformation editor and use the finding’s own timestamp:source | extend TimeGenerated = todatetime(timestamp) - Review and create.
Then open the new Data Collection Rule (Monitor → Data Collection Rules), switch to JSON View and copy the immutableId (it starts with dcr-). The stream name is Custom-SuiteAudit_CL.
Step 4: Let the app write to the DCR
On the Data Collection Rule, go to Access control (IAM) → Add role assignment, choose Monitoring Metrics Publisher and assign it to the app registration from Step 1.
Role assignments can take up to around 30 minutes to take effect. A 403 straight after setup usually means it hasn’t applied yet.
Step 5: Create the SuiteAudit destination
| Field | Value |
|---|---|
| Name | Microsoft Sentinel |
| Destination Type | Microsoft Sentinel (Logs Ingestion API) |
| Endpoint URL | The DCE Logs Ingestion URI from Step 2, with no trailing slash |
| Sentinel: Azure AD Tenant ID | Directory (tenant) ID |
| Sentinel: Azure AD Client ID | Application (client) ID |
| Sentinel: Azure AD Client Secret | The client secret value |
| Sentinel: DCR / Stream Name | <immutableId>/streams/Custom-SuiteAudit_CL, e.g. dcr-0a1b2c…/streams/Custom-SuiteAudit_CL |
| Enabled | Ticked |
Step 6: Verify in Sentinel
New custom tables can take a few minutes to show their first rows. Then, in Sentinel → Logs:
SuiteAudit_CL
| summarize Events = count() by account, event_type
Risk score trend per account:
SuiteAudit_CL
| where event_type == "posture_summary"
| summarize RiskScore = arg_max(TimeGenerated, risk_score) by account, bin(TimeGenerated, 1d)
| project TimeGenerated, account, risk_score
| render timechart
New critical and serious findings, ready to save as a scheduled analytics rule:
SuiteAudit_CL
| where event_type == "finding_new" and severity in ("critical", "serious")
| project TimeGenerated, account, check_id, severity, subject_kind, subject, self_approved
Splunk vs Sentinel at a glance
| Splunk | Microsoft Sentinel | |
|---|---|---|
| Middleware needed | None, direct to HEC | None, direct to the Logs Ingestion API |
| Authentication | Static HEC token (Authorization: Splunk …) |
Entra ID app registration, OAuth client-credentials token requested on every delivery |
| Azure / Splunk setup | One HEC token and an index | App registration, DCE, DCR + custom table, one role assignment |
| Schema | Schema-on-read: JSON fields extracted automatically | Schema-on-write: columns defined by the DCR sample |
| Credential to rotate | HEC token | Client secret (set a reminder before it expires) |
Troubleshooting
SuiteAudit never fails silently. Every destination record shows a Last Send Status (for example OK: 12/12 events sent, or the exact HTTP error returned) and a Last Send Attempt time. The SIEM Log tab in SuiteAudit keeps the exact JSON of every delivery with its result, so you can see precisely what was sent and when.
- Splunk
401/403: the token is wrong or disabled, or HEC is disabled under Global Settings. - Splunk
400“Incorrect index”: the token isn’t allowed to write to the selected index. - Sentinel “token exchange” error: check the tenant ID, client ID and secret. An expired client secret is the usual culprit months later.
- Sentinel
403: the Monitoring Metrics Publisher role is missing on the DCR, or hasn’t applied yet. - Sentinel
404: check the DCR / Stream Name. It must be<immutableId>/streams/Custom-SuiteAudit_CL, and the DCE and DCR must be linked. - Connection or certificate errors: the endpoint isn’t reachable from the internet, or its certificate isn’t from a public CA.
Using a different SIEM?
SuiteAudit also offers a Generic HTTPS Webhook destination. It sends the full delivery shown at the top of this guide as one JSON POST with an Authorization: Bearer <token> header. QRadar, Elastic, Sumo Logic and most MSSP collection platforms can receive that directly.
Bring NetSuite into your SOC
NetSuite is where the money moves, and it deserves the same monitoring as the rest of your estate. If you’d like to see SuiteAudit’s findings flowing into your own Splunk or Sentinel, explore SuiteAudit or talk to the AVT team. We’ll help you get the first delivery landing.